Data & Infrastructure
A Database Dashboard Is Useful. It Is Not a Recovery Plan.
Google’s new AlloyDB Omni Web UI is a reminder that visibility into a self-managed database helps operations—but only when alerts, backups and ownership are defined.
If your database dashboard turns red, does everyone know what happens next?
A clearer view of CPU use, storage activity and slow queries can make a database team more effective. It cannot, by itself, decide whether an alert matters, stop a bad change or prove that a backup can be restored. That distinction is worth keeping in mind as more database platforms add polished operational dashboards.
Google announced a generally available Web UI for AlloyDB Omni on October 28. Google describes AlloyDB Omni as a downloadable, self-managed PostgreSQL-compatible database offering, and says the Web UI is a read-only console for monitoring cluster health, hardware telemetry, query behavior and configuration information. Google’s October 28 announcement is the primary source. Google’s release notes document the Web UI’s GA status for supported versions and list an October 30 operator issue and its remediation context.
These are Google product statements, not independent performance tests or a claim that AlloyDB Omni is right for every PostgreSQL deployment. The practical lesson applies more broadly: observability is valuable only when it connects to a safe operating response.
What changed—and what it does not change
Google says the Web UI provides a visual, read-only view of selected self-managed AlloyDB Omni environments. Its stated scope includes monitoring information such as CPU, memory, storage I/O, active connections, query activity and cluster topology, with Prometheus needed for complete host metrics. Read-only design matters: a diagnostic screen that cannot issue database changes reduces one kind of operational risk.
But a dashboard does not remove the work of operating a database. Someone still needs to own upgrades, user access, schema changes, capacity planning, backup retention, restore tests and incident communications. A graph that shows rising storage use is evidence; it is not a decision about whether to expand capacity, clean data, adjust retention or investigate a runaway process.
Nor does “generally available” mean every feature applies to every installation. Confirm the exact AlloyDB Omni version, deployment method, operating system or container platform, monitoring prerequisites, support terms and licensing before planning a rollout. Google’s documentation also shows why release notes belong in the operating routine: its October 30 note describes a Kubernetes-operator certificate issue for certain earlier versions that can affect high-availability health checks. Follow official documentation for the applicable version rather than copying a generic fix into production.
Turn visibility into an operating loop
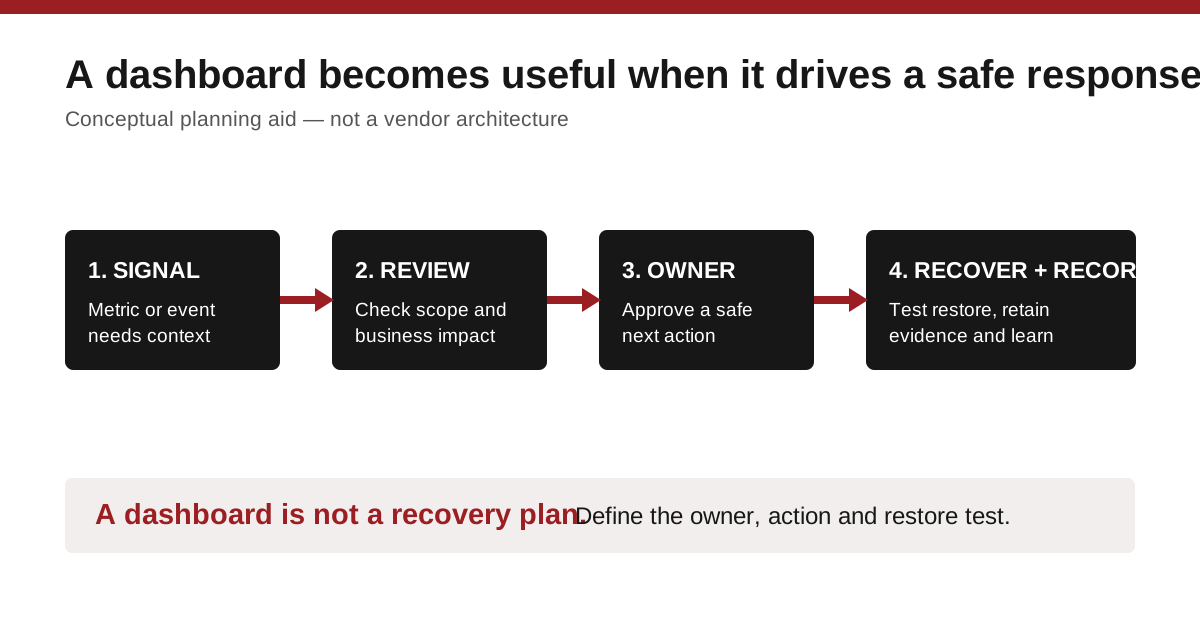
For any self-managed database, write down a short response loop before adding another monitoring screen:
- Signal: Which metrics or events deserve attention? Define the useful ones—such as failed backups, high storage consumption, replication concerns or elevated connection counts—in the context of the application.
- Owner: Who receives the alert, who investigates and who can approve a change? A named owner is better than a shared inbox.
- Action: What safe first step is allowed? This might be collecting evidence, pausing a nonessential job or escalating to a provider. Avoid automatic production changes unless they have been tested and approved.
- Recovery: Where is the restorable copy, how recent is it, and how will the team verify it without damaging production?
- Learning: Record the cause, the action taken and the evidence. That turns the next alert into a faster, more informed response.
The original diagram below is a planning aid, not a Google architecture diagram or a certified incident runbook.
Ask for evidence, not just screenshots
When evaluating a new database tool, ask the provider or IT team to walk through a non-production scenario. For example, use a test workload to show how a slow query or a capacity warning appears, what contextual data is available and how the team records its decision. Then separately demonstrate a restore of representative data to a safe environment.
That second demonstration matters because monitoring and recovery solve different problems. Monitoring helps a team notice and understand conditions; recovery helps it regain usable data after a failure, corruption or mistake. A proposal should include both, plus the access controls that determine who can view production information.
Also ask what data leaves the environment. Does the dashboard rely on local monitoring, an external service or both? Who can see connection profiles, query text or operational metadata? The answers can affect privacy, security and support requirements even when the interface itself is read-only.
The small-business implication
Smaller teams do not need an elaborate operations center to benefit from this approach. A simple, documented set of checks—backup status, storage trend, error rate, named owner and periodic restore test—can be more useful than a sophisticated dashboard nobody reviews. Tools should reduce uncertainty, not create another alert destination.
Google’s update is a useful prompt to review the operational side of any self-managed PostgreSQL environment. Before adding a new screen, ask: when it shows us a problem, can we name the owner, the next safe step and the last tested restore point?
Sources and editorial note
- Google Cloud blog — published October 28, 2026; accessed November 2, 2026. Primary source for product scope and vendor statements.
- Google Cloud release notes — updated October 30, 2026; accessed November 2, 2026. Documentation for GA scope and version-specific operations.
Sources are three to five days old, so this article uses the permitted seven-day freshness window. No DC Supplies testing, customer result, availability claim, database-security guarantee or product inventory is implied.